Pattern Recognition in Umpire Strike Zone Variations for Enhanced MLB Live Spread Positioning
Iris Berger · Jun 17, 2026
Pattern Recognition in Umpire Strike Zone Variations for Enhanced MLB Live Spread Positioning
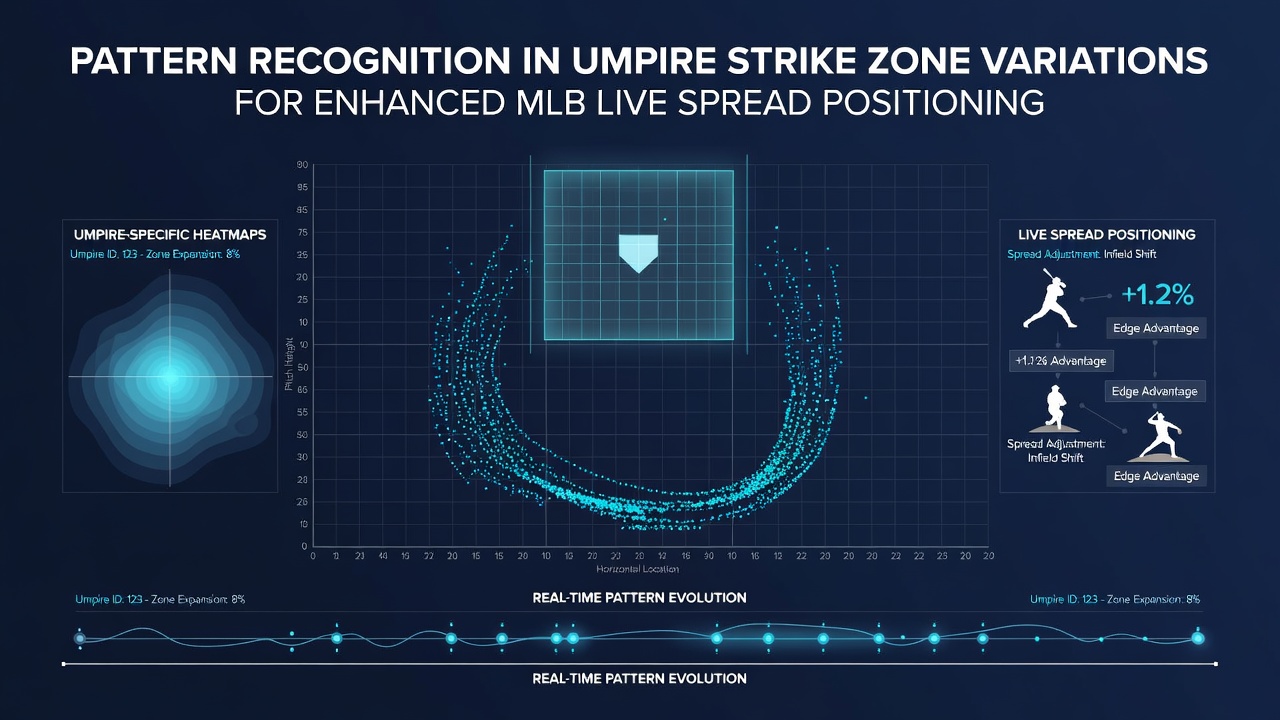
MLB umpires exhibit measurable differences in strike zone boundaries that shift according to game context, count, and individual tendencies, and analysts track these patterns through pitch tracking systems to inform live positioning on run line markets. Data compiled by MLB Advanced Media shows that zone edges can expand or contract by as much as two inches horizontally depending on the assigned crew, creating measurable edges when bettors monitor real-time deviations during innings.
Systems such as Statcast record every pitch coordinate, allowing pattern recognition models to flag when an umpire consistently calls the outside corner tighter after the fifth inning or when home-plate personnel grant extra width on 3-2 counts. These variations directly influence expected run totals because borderline pitches that become strikes alter swing decisions and force pitchers to adjust locations mid-at-bat.
Documented Umpire Tendencies and Data Sources
Studies published by academic researchers at universities with access to public pitch data have quantified how certain umpires demonstrate repeatable zone shifts based on leverage and score differential. Observers note that left-handed batters sometimes receive a slightly higher strike zone when veteran crews work behind the plate, while right-handed batters encounter more compressed boundaries during day games in specific ballparks. Such findings come from aggregated datasets rather than isolated incidents, and the patterns repeat across multiple seasons.
Figures released through league tracking programs reveal that the average called strike percentage on pitches one inch outside the rule-book zone varies by more than four percentage points among full-time umpires. Bettors who integrate these baselines into live models can anticipate when a pitcher benefits from an expanded zone after a quick first inning or when a starter faces pressure because the zone has tightened following multiple walks.
Real-Time Pattern Recognition Techniques
Algorithms process sequential pitch data within each game to detect deviations from an umpire’s established profile. When the observed zone moves inward on the glove side during high-leverage at-bats, models update projected run expectancy and signal potential adjustments to live spread prices. Teams monitoring these feeds have documented instances where early recognition of zone contraction allowed repositioning before oddsmakers fully reflected the change in their lines.
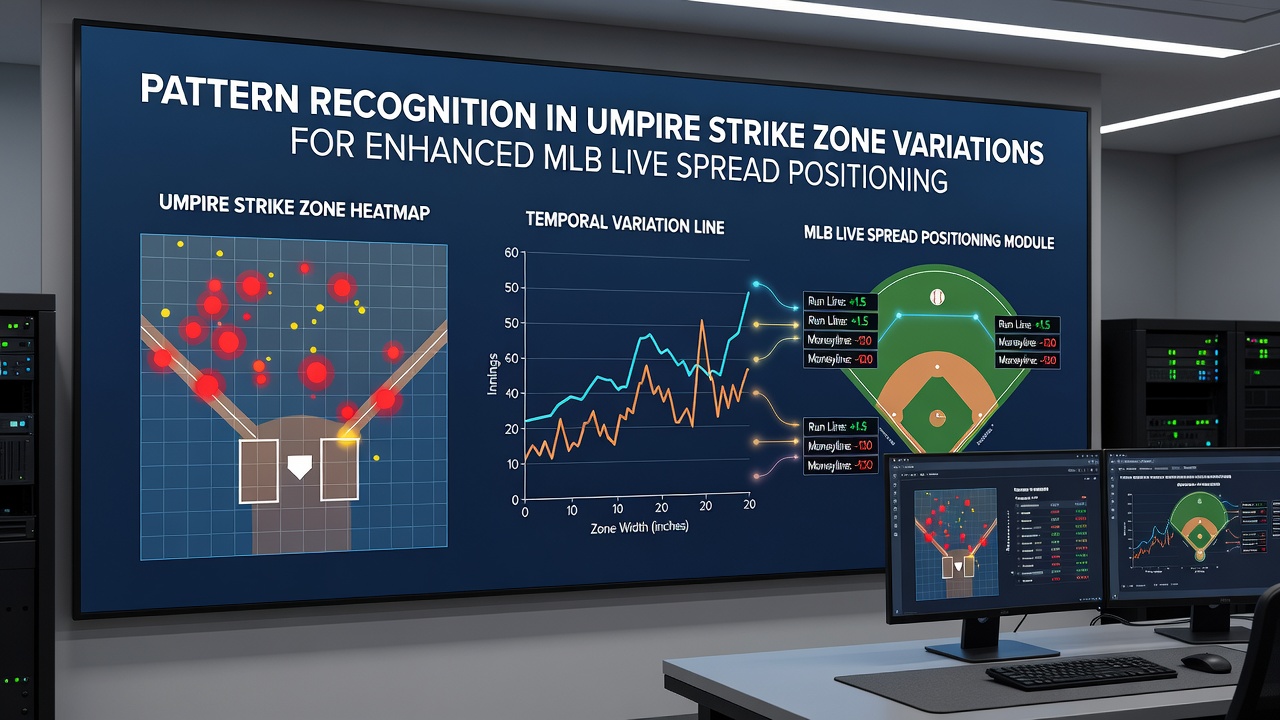
Pattern libraries also incorporate count-specific tendencies, because many umpires widen the zone on two-strike pitches yet remain consistent on 0-0 offerings. By cross-referencing current count, inning, and historical umpire data, analysts generate probability adjustments that feed directly into spread calculations. The approach relies on continuous calibration rather than static rules, since crew consistency can vary even within a single series.
Integration with Live Run Line Markets
Live spread positioning benefits when models translate zone shifts into updated win probabilities and margin expectations. A documented expansion of the zone on the outer half, for example, tends to suppress hard contact and lower scoring rates in subsequent innings, prompting earlier movement on under-priced run lines. Conversely, contraction often elevates walk rates and extends innings, creating opportunities on the opposite side of the spread.
Operators have observed that these adjustments occur most frequently between the fourth and seventh innings, when pitch counts rise and fatigue influences both pitcher command and umpire decision speed. Monitoring systems therefore prioritize rapid updates during this window, delivering revised projections while liquidity remains available on major sportsbooks.
Seasonal Context Entering June 2026
Entering the 2026 campaign, MLB continued its use of expanded replay review protocols that indirectly affect umpire behavior by increasing accountability on borderline calls. Early-season data through June 2026 indicated that crews working the second half of doubleheaders showed slightly larger zone variability compared with day-game crews, a pattern consistent with prior years yet refined by newer tracking resolution. Analysts tracking these developments have incorporated the updated baselines into models used for live positioning across divisional matchups.
Case Examples from Recent Tracking
One series in May 2026 featured an umpire whose zone expanded measurably on the low-outside corner after the starter reached 85 pitches. Live models flagged the deviation within two innings, and subsequent scoring remained below projected totals, aligning with the adjusted run-line expectations. Similar observations appeared in interleague play where visiting umpires demonstrated tighter zones on breaking pitches during night games, producing measurable over-performance by home-team bullpens relative to pregame totals.
These examples illustrate how pattern recognition operates at the intersection of historical profiles and in-game data streams rather than relying on anecdotal judgment. Continuous validation against actual pitch outcomes keeps the models calibrated throughout the schedule.
Conclusion
Pattern recognition applied to umpire strike zone variations supplies a structured framework for refining live spread decisions in MLB markets. By combining granular pitch data with established umpire baselines, analysts generate timely updates that reflect evolving zone boundaries during individual contests. As tracking technology advances and datasets grow, the precision of these adjustments continues to improve, offering participants clearer signals for positioning throughout each game.