22 May 2026
Unlocking Schedule Density Patterns for Strategic Wager Timing in Multi-Team Hockey Markets

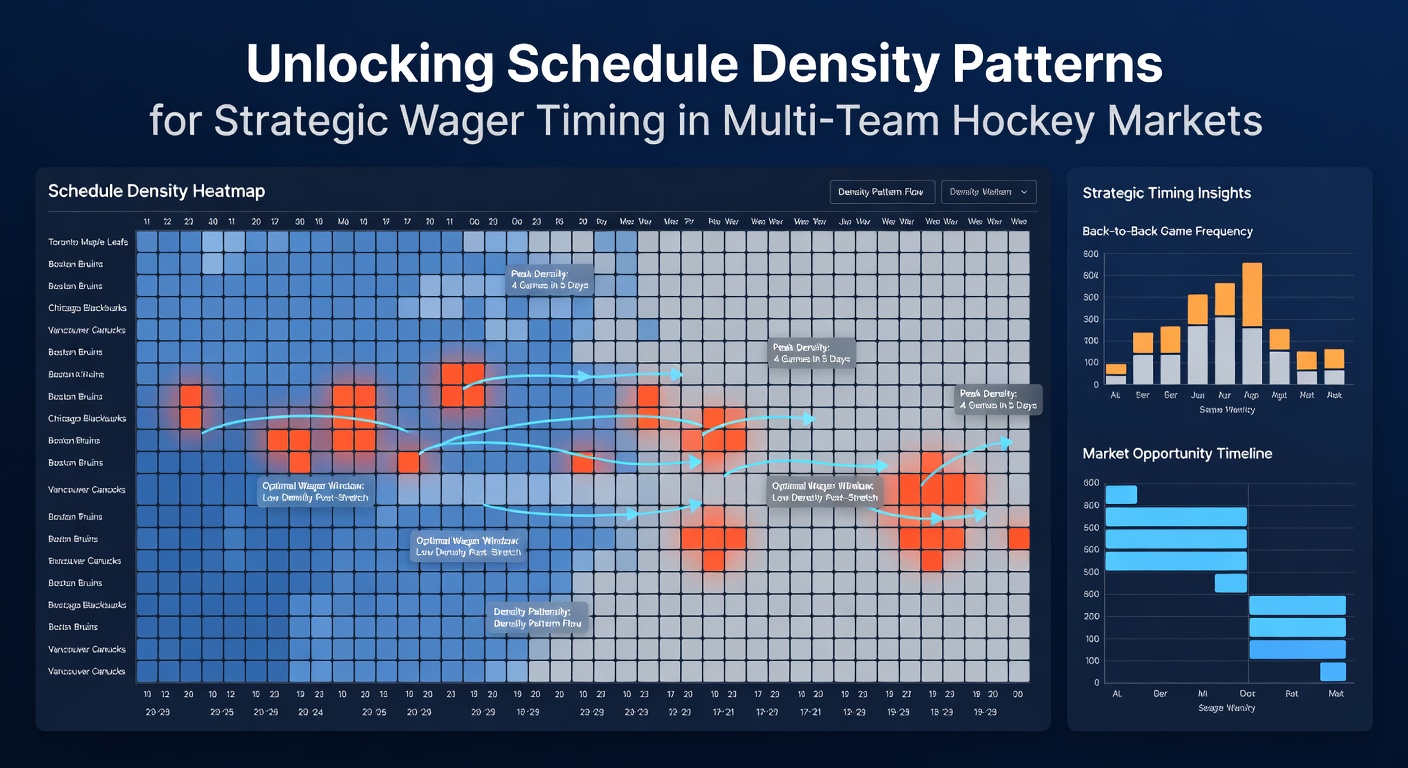
Schedule density in professional hockey refers to the clustering of games within short time frames, and analysts track these patterns through detailed season calendars released by league offices each summer. Teams often face sequences of back-to-back contests, three games in four nights, or extended road trips that compress recovery windows, and these arrangements directly influence player availability reports, line combinations, and overall team output metrics. Observers note that density spikes occur most frequently during November through February when the regular season calendar packs in the highest volume of midweek matchups across both conferences.
Defining Schedule Density in Hockey Contexts
Data compiled from league schedules reveals that an average NHL team encounters between 18 and 22 back-to-back sets per season, while certain clubs in larger media markets absorb additional matinee games that further reduce rest intervals. Researchers examining performance logs have documented measurable drops in shot attempt rates and goaltender save percentages on the second night of such pairings, particularly when travel distance exceeds 1,000 miles between venues. These patterns become especially relevant for multi-team wager structures because bettors can align selections across several contests scheduled on the same dense night, allowing coordinated timing that accounts for cumulative fatigue across rosters rather than isolated matchups.
Identifying Peak Density Windows for Timing Decisions
League calendars typically cluster high-density periods around holiday weekends and All-Star breaks, creating predictable stretches where multiple teams play on consecutive evenings. In the 2025-2026 season, for instance, the stretch from late December into early January featured 14 teams involved in at least one three-in-four sequence within a 10-day span, and similar concentrations appear in the schedule released for spring 2026. Those who study these calendars cross-reference historical box scores with current injury reports to isolate games where second-night performance declines have historically exceeded league averages by measurable margins. Strategic placement of wagers therefore shifts toward earlier windows in the betting cycle, often before line movements reflect the full impact of compressed schedules on team totals and player props.
Regional Variations Across Conferences
Eastern Conference clubs tend to encounter slightly higher travel burdens during density peaks because of denser geographic distribution of arenas, whereas Western Conference teams face longer flights that compound recovery challenges. Figures released by the league show that Pacific Division squads logged an average of 42,000 air miles during the 2024-2025 campaign, with the heaviest loads coinciding with back-to-back clusters in February. Bettors constructing multi-team markets therefore adjust stake timing by monitoring divisional schedules first, since intra-conference games during dense periods produce more consistent statistical deviations than cross-country matchups. This approach allows for layered positioning across several games without waiting for last-minute roster updates that often arrive after early odds have stabilized.
Integrating Density Data with Multi-Team Market Structures
Multi-team hockey markets commonly combine moneyline selections, totals, and period props from three or more games occurring on the same evening, and density analysis supplies an additional filter for sequencing those combinations. When several teams share overlapping rest disadvantages, correlations in scoring suppression or penalty minutes become more pronounced, which in turn affects the viability of correlated parlay legs. Analysts who maintain databases of schedule-driven performance splits note that totals markets in second games of back-to-backs have trended under the posted number at a higher frequency than first-game equivalents over the past five seasons. Timing entries into these markets therefore favors the period immediately after the first slate of results posts, allowing incorporation of real-time confirmation that density effects are materializing as projected.
During May 2026, as the league transitions from regular-season density patterns into playoff scheduling, observers continue to apply the same frameworks to conference final series where teams may play every other night for extended stretches. Playoff calendars compress further because of travel logistics between distant arenas, and historical data indicates elevated rates of special-teams variance under those conditions. Multi-team market participants who tracked regular-season density therefore carry forward similar timing protocols into postseason wagering windows, adjusting entry points based on which clubs have navigated the longest sequences without extended rest.
Practical Application Through Historical Case Examination
One documented stretch in January 2025 featured five teams playing three games in four nights across overlapping dates, and subsequent performance reviews showed a 12 percent reduction in even-strength expected goals for those clubs on the third night compared with season-long baselines. Bettors who positioned multi-team totals selections ahead of that window captured movement on under outcomes before public betting volume adjusted the lines. Similar sequences appear regularly enough in league calendars that systematic review of upcoming months allows advance mapping of high-probability alignment opportunities. Coordination with real-time sources such as official league injury reports further refines the timing, since last-minute absences amplify density-related effects already embedded in the schedule structure.
Conclusion
Schedule density patterns supply measurable inputs for determining optimal entry points into multi-team hockey markets, and consistent application of calendar analysis across multiple seasons demonstrates repeatable statistical relationships. Those who integrate travel logs, rest differentials, and historical performance splits maintain structured approaches to wager sequencing that account for the full distribution of games rather than isolated events. As the 2026 calendar unfolds, continued monitoring of these clusters remains central to timing decisions across both regular-season and postseason multi-team structures.